
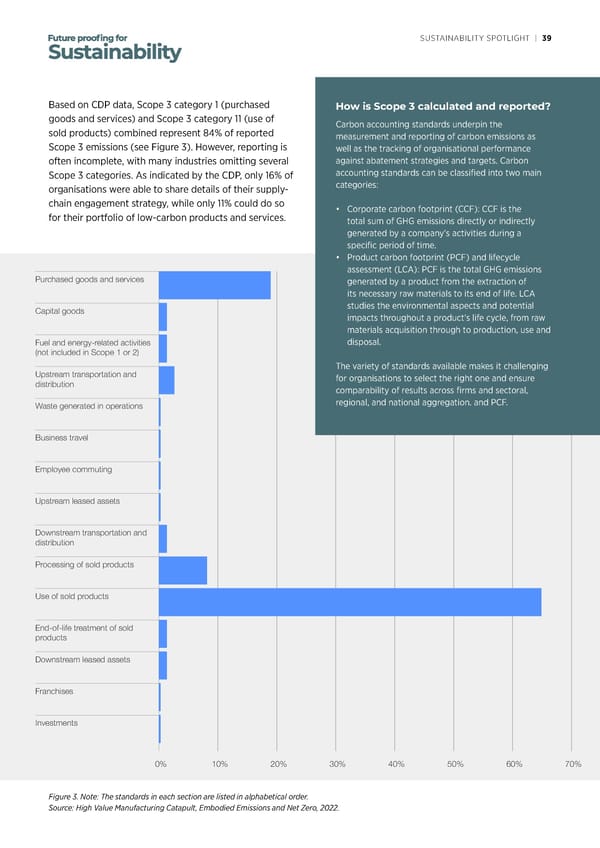
SUSTAINABILITY SPOTLIGHT | 38 SUSTAINABILITY SPOTLIGHT | 39 Why does Scope 3 matter?While industries such as cement and concrete, and Based on CDP data, Scope 3 category 1 (purchased How is Scope 3 calculated and reported? Scope 3 emissions can account for more than 70% of transport services and logistics, have lower Scope 3 goods and services) and Scope 3 category 11 (use of Carbon accounting standards underpin the a business’s carbon footprint, based on data from the emissions, this category becomes significant for other sold products) combined represent 84% of reported measurement and reporting of carbon emissions as UN Global Compact. Figure 2 highlights that di erent industries, including chemicals, electronics, automotive Scope 3 emissions (see Figure 3). However, reporting is well as the tracking of organisational performance and food. Consequently, any decarbonisation e orts in often incomplete, with many industries omitting several against abatement strategies and targets. Carbon industries face di erent Scope 3 situations and these sectors are likely to require intense cooperation Scope 3 categories. As indicated by the CDP, only 16% of accounting standards can be classified into two main challenges.among original equipment manufacturers (OEMs), organisations were able to share details of their supply-categories: consumer brand companies and suppliers.chain engagement strategy, while only 11% could do so • Corporate carbon footprint (CCF): CCF is the for their portfolio of low-carbon products and services. total sum of GHG emissions directly or indirectly generated by a company’s activities during a specific period of time. • Product carbon footprint (PCF) and lifecycle assessment (LCA): PCF is the total GHG emissions Purchased goods and services generated by a product from the extraction of its necessary raw materials to its end of life. LCA Capital goods studies the environmental aspects and potential impacts throughout a product’s life cycle, from raw Cement and concrete materials acquisition through to production, use and Fuel and energy-related activities disposal. Transport services and logistics(not included in Scope 1 or 2) The variety of standards available makes it challenging Paper and pulpUpstream transportation and for organisations to select the right one and ensure distribution comparability of results across firms and sectoral, Metals and mining regional, and national aggregation. and PCF. Waste generated in operations Other materials Business travel Chemicals Biotech, healthcare and pharmaEmployee commuting Food and beverage processing Upstream leased assets Apparel ConstructionDownstream transportation and distribution Light manufacturing Processing of sold products Transport OEMs Electric and electronic Use of sold products manufacturing Powered machinery End-of-life treatment of sold products 0%10%20%30%40%50%60%70%80%90%100% Downstream leased assets Scope 1Scope 2Scope 3 Franchises Source: Extracted from CDP and Capgemini Invent, From Stroll to Sprint: A Race Against for Corporate Decarbonization, July 2023; CDP, CDP Investments 0% 10% 20% 30% 40% 50% 60% 70% Figure 2. Source: Extracted from CDP and Capgemini Invent, From Stroll to Sprint: A Race Against Time for Corporate Decarbonization, July 2023; Figure 3. Note: The standards in each section are listed in alphabetical order. CDP, CDP Technical Note: Relevance of Scope 3 Categories by Sector, 2022.Source: High Value Manufacturing Catapult, Embodied Emissions and Net Zero, 2022.
 Sustainability Spotlight Magazine Page 38 Page 40